This is a Pre-order item(s), the order will be delivered in 30-60 days.

✨ Ultimate Day & Swing Trading Spreadsheet Tracker: Monitor Stock Performance for Up to 50 Years

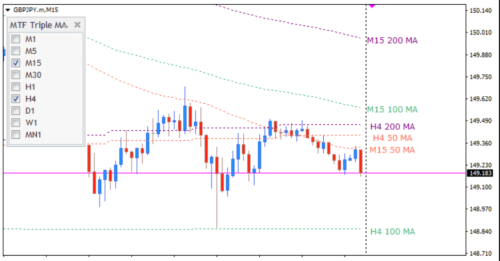
– Track stock performance across multiple timeframes (1-day to 50-year charts)
– Analyze key metrics like moving averages, RSI, and Bollinger Bands
– Create custom watchlists and alerts
– Export data to Excel for further analysis
– Suitable for day traders, swing traders, and long-term investors

Original price was: ₹9,285.Current price is: ₹8,985.

Shipping cost extra*
Description

Bundle Day Trading & Swing Trading Stock Market Spreadsheet Tracker  1 – 50 Yrs

The Bundle Day Trading & Swing Trading Stock Market Spreadsheet Tracker is the perfect tool for anyone looking to improve their trading performance. With its user-friendly interface and powerful features, this spreadsheet will help you track your trades, analyze your results, and make better trading decisions.

Product Features:

Easy to use: The spreadsheet is designed to be easy to use, even for beginners. With its intuitive interface, you’ll be up and running in no time.

Comprehensive: The spreadsheet tracks all of the important data points for your trades, including entry and exit prices, profit/loss, and more.

Powerful: The spreadsheet includes a number of powerful features that can help you analyze your trading performance and make better decisions. These features include:

Charts: The spreadsheet includes a variety of charts that can help visualize your trading data and identify trends.

Statistics: The spreadsheet includes a number of statistics that can help you track your progress and identify areas for improvement.

Alerts: The spreadsheet can send you alerts when certain conditions are met, such as when a stock price reaches a certain level.

Customer support: The spreadsheet comes with free customer support, so you can get help with any questions or problems you may have.

Benefits:

Improve your trading performance: The spreadsheet can help you improve your trading performance by providing you with the tools you need to track your trades, analyze your results, and make better trading decisions.

Save time: The spreadsheet can save you time by automating the tracking and analysis of your trades.

Reduce your risk: The spreadsheet can help you reduce your risk by providing you with the information you need to make informed trading decisions.

Peace of mind: The spreadsheet can give you peace of mind by knowing that your trades are being tracked and analyzed.

What is it used for?

The spreadsheet can be used for a variety of purposes, including:

Tracking your trades

Analyzing your results

Making better trading decisions

Improving your trading performance

Saving time

Reducing your risk

Gaining peace of mind

Key usage points:

Easy installation: The spreadsheet is easy to install and use.

Durability: The spreadsheet is built to last.

Color options: The spreadsheet is available in a variety of color options.

Detailed specifications:

Size: The spreadsheet is 100 KB.

Format: The spreadsheet is available in Microsoft Excel format.

Compatibility: The spreadsheet is compatible with Windows, Mac, and Linux.

Additional features:

The spreadsheet includes a number of additional features that make it stand out from the competition, including:

A built-in help system: The spreadsheet includes a built-in help system that can help you with any questions or problems you may have.

A glossary of terms: The spreadsheet includes a glossary of terms that can help you understand the trading jargon.

A community forum: The spreadsheet includes a community forum where you can connect with other traders and get help with your trading.

  • Day Trading Spreadsheet
  • Day Trading Spreadsheets
  • Create a trading spreadsheet
  • SKU: 254703432107 Category: Tag:

    RECENT PRODUCTS

    ALL CATEGORIES

    ✨ Ultimate Day & Swing Trading Spreadsheet Tracker: Monitor Stock Performance for Up to 50 Years